At home I needed a way to measure temperature and humidity over a long period (3–4 weeks) and display the measurements in a graph. To start, I focused on measuring temperature only and displaying it in the Arduino Serial Monitor.
This post is a quick note. There are already many detailed tutorials on this topic, so this is mainly for my own reference.
Because I have an Arduino and a bunch of sensors, there wasn’t much to decide—just which sensor to use. I have the Allnet Sensor Kit, which includes several temperature sensors.
I chose the DHT11 because it ‘s very easy to use: no calibration, just plug it in and read the values. More capable variants exist (for example, the DHT22 ). Here is a brief comparison.
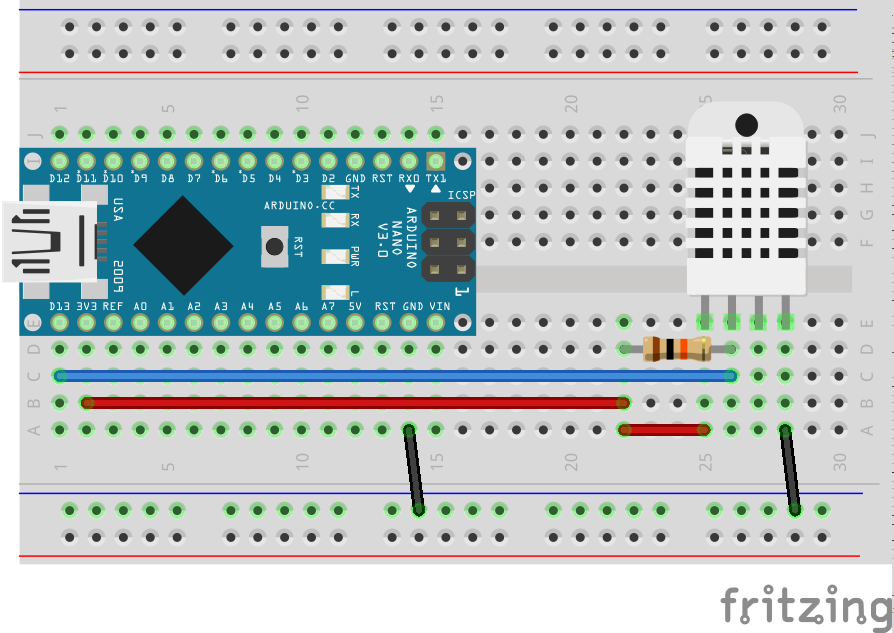
Here is the breadboard view. This time I used an Arduino Nano.
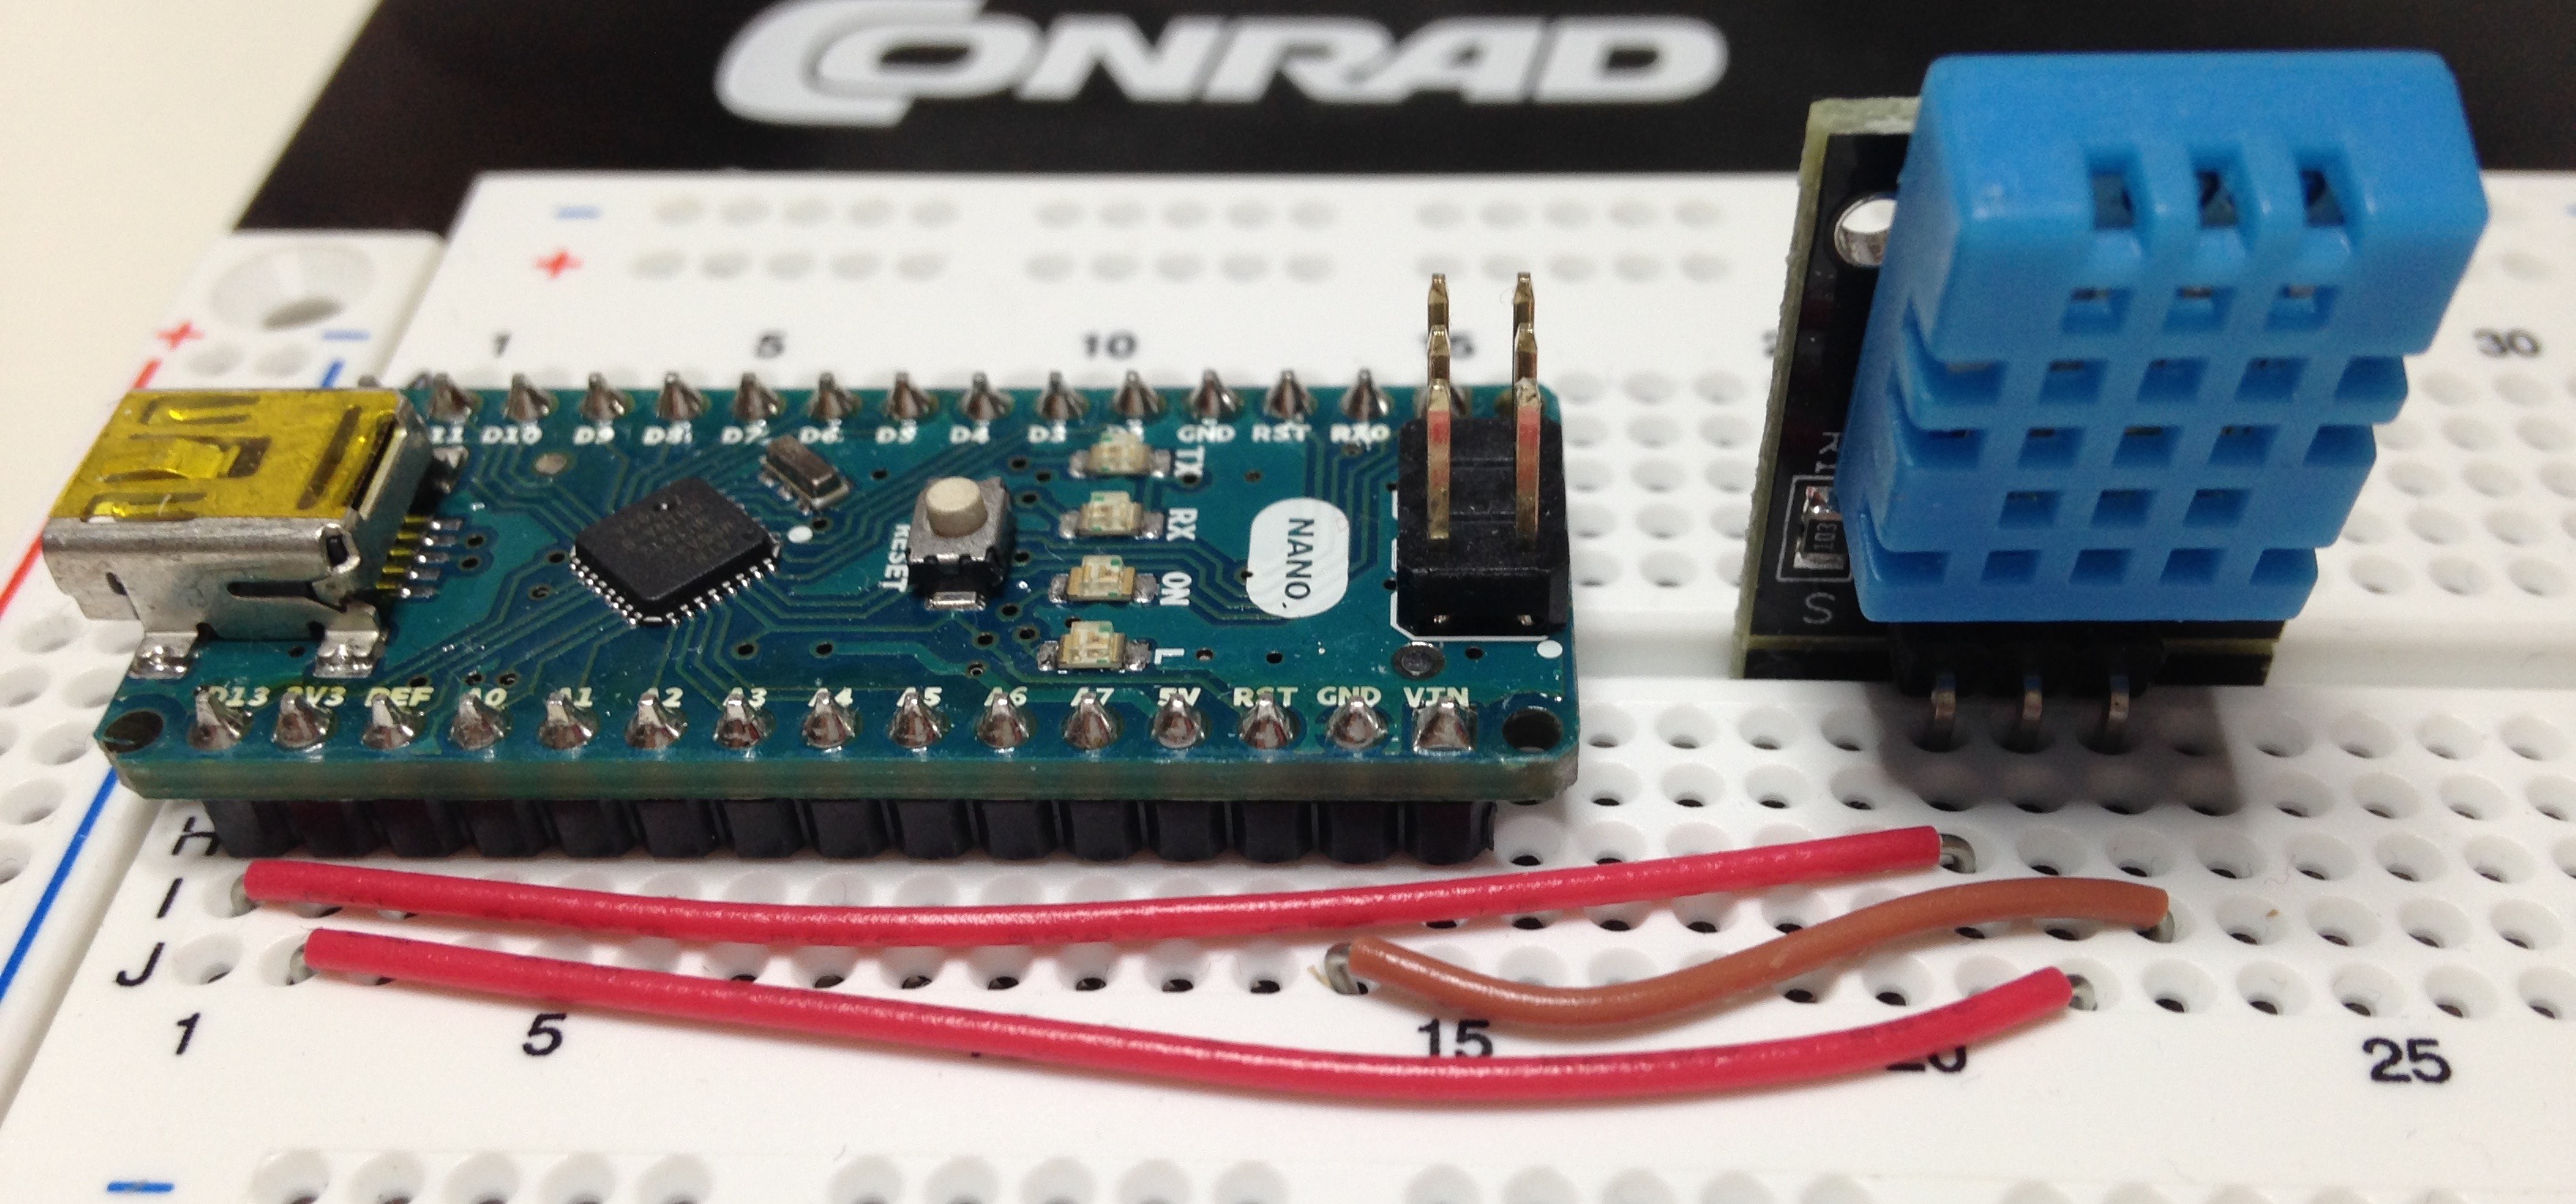
The actual setup.
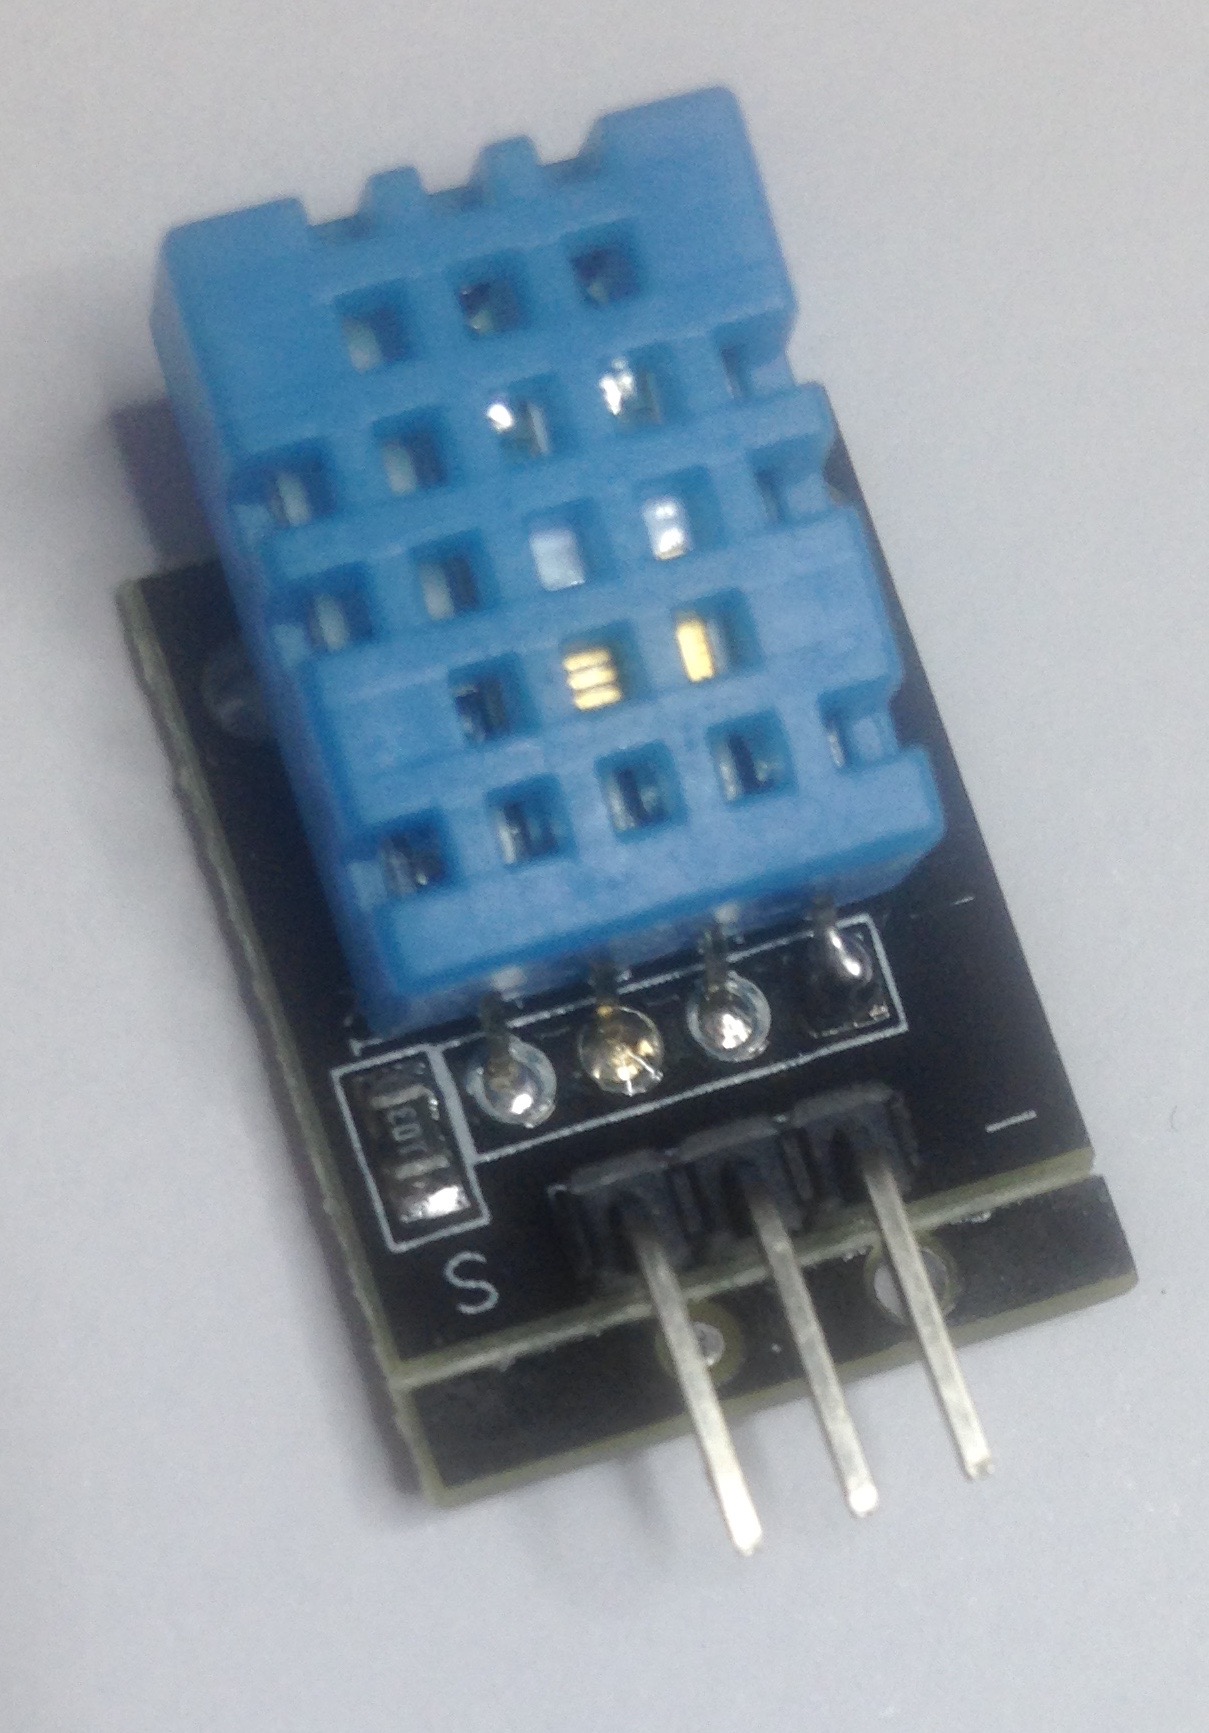
The sensor I have includes the pull-up resistor, so the wiring is slightly different. From left to right: Data, Voltage, Ground.
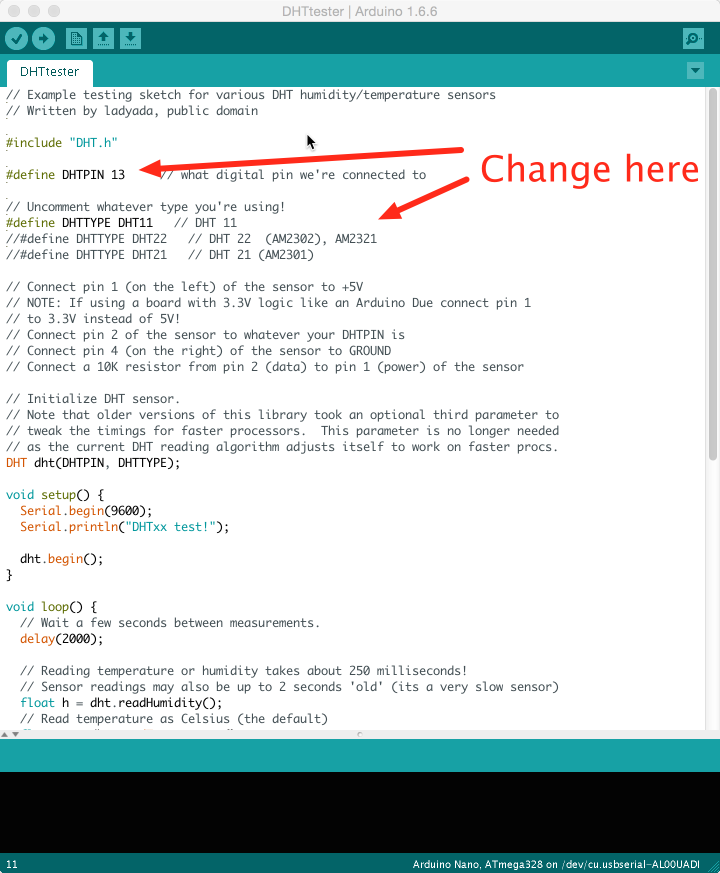
Now the software. There ‘s not much code needed to test the sensor. The example comes with the Arduino IDE: open File → Examples → DHT sensor library → DHTtester and set the correct Arduino data pin (line 6) and the correct DHT model (lines 9–11).
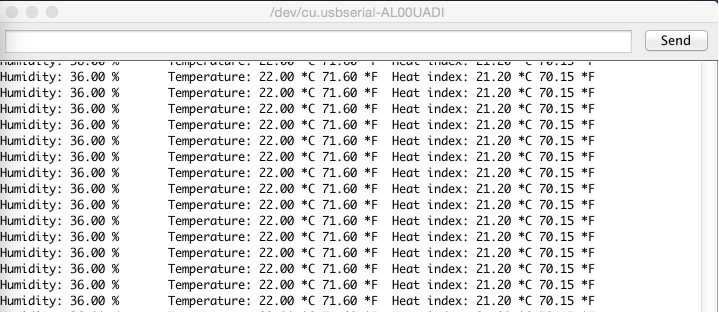
Finally, the output. The sketch takes and displays a measurement every second.
Next, I want to transmit the data wirelessly to a web service. I ‘m undecided between a Wi‑Fi module and the 433 MHz transmitter/receiver I blogged about earlier ({% post_url 2015-12-08-hello-world-on-433mhz %}).
UPDATE 2016-04-21: Use an ESP8266 as described in [this post]({% post_url 2016-04-21-measuring-temperature-with-an-esp8266 %}).
Done for today!